Published on March 24, 2020 by:

Hi! I am the creator of peatch. I help tech entrepreneurs convince investors. I am a director @ Roland Berger Tech Ventures.
To assess the feasibility and the probability of success of your next fundraising round, it might be a good idea to benchmark your metrics (ARR/MRR, growth, retention…) against companies raising rounds in your category:
- What ARR/MRR do we need to raise our series A/B/C?
- How much can I raise considering my ARR/MRR?
- Are we growing fast enough to convince investors at Seed/Series A/Series B/Series C stage?
Those are central questions and it’s actually quite difficult to answer it. Why? Because getting a solid and up-to-date benchmark of these metrics is not easy since 1) market conditions are changing every year (or quarter) 2) a reliable benchmark requires enough data to make it significant.
Professionals with the most accurate and up-to-date benchmark are investors and fundraising advisors/investment bankers who build their own perception of the market by screening hundreds or thousands of opportunities every year.
By pulling out data points from US companies (~50%), European companies (~33%) and RoW (~17%), and by sanity-checking it against our professional experiences as a fundraising advisor, we have built a benchmark you can use to assess your companies metrics when considering your next fundraising round.
The median equity journey
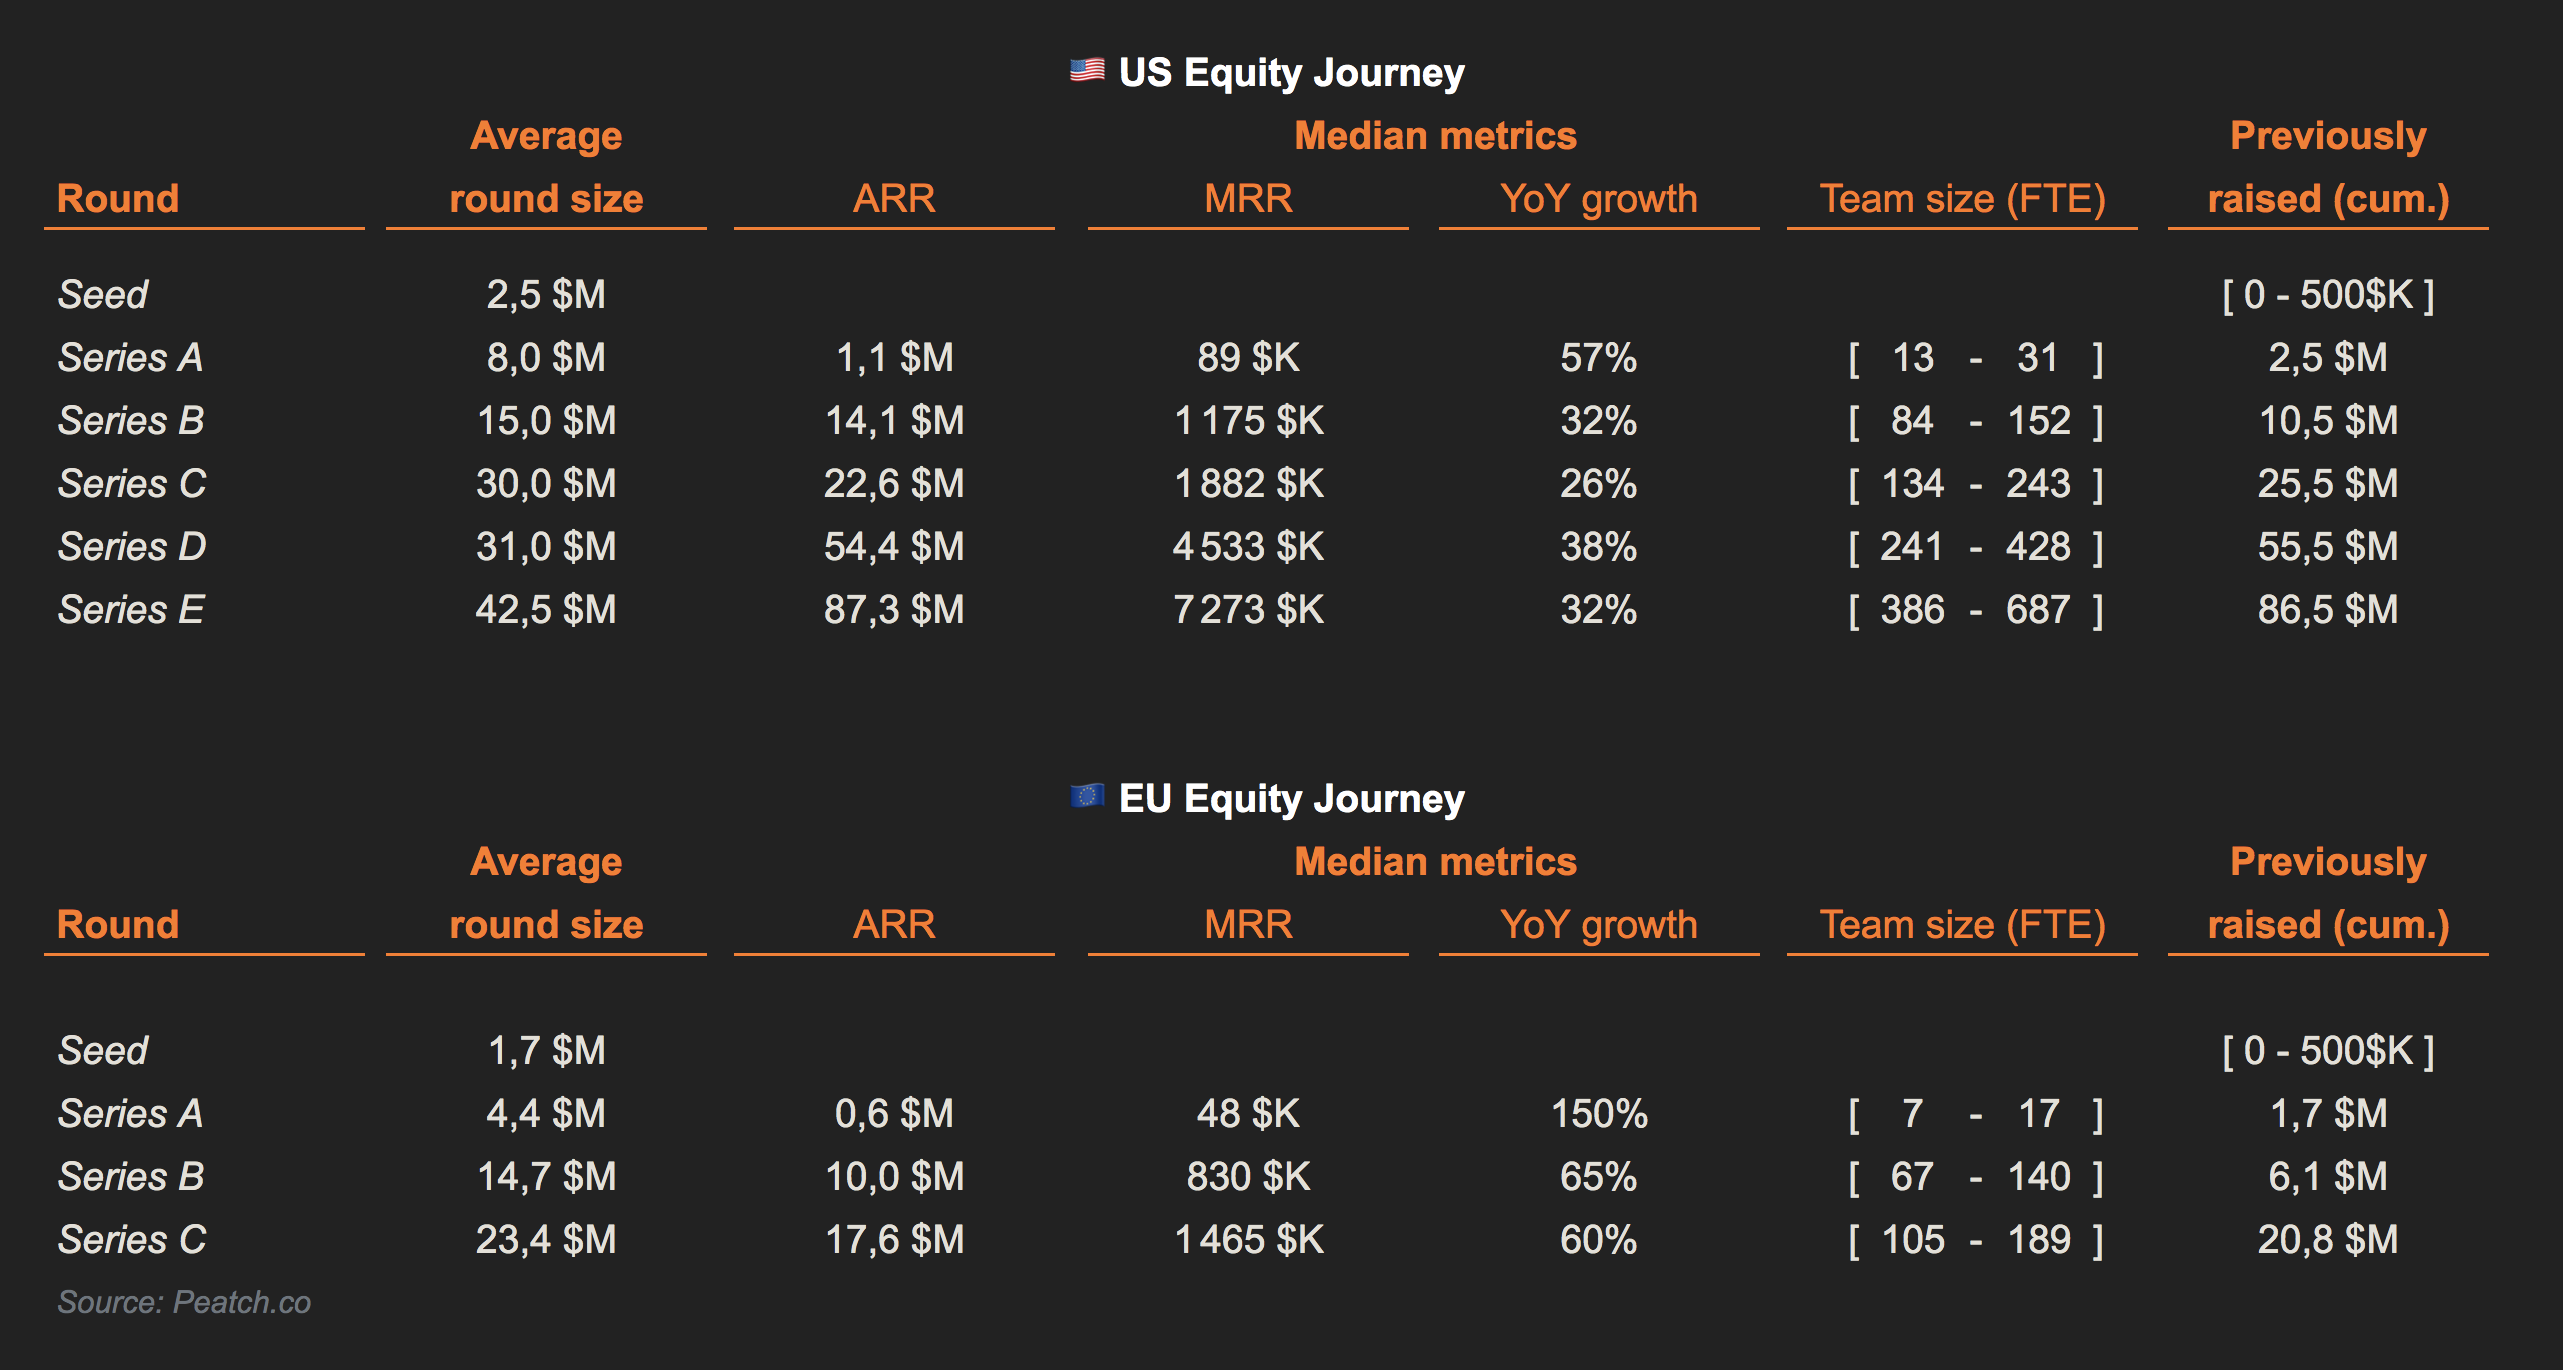
Examples:
- On average, a European SaaS Startup will raise a $4.4M Series A with an ARR of $0.6M / MRR of $48K growing at 150% YoY and with a team size of 7 to 17 full time employees (25th and 75th percentile)
- On average, a US SaaS Startup will raise a $8M Series A with an ARR of $1.1M / MRR of $89K growing at 57% YoY and with a team of 13 to 31 full time employees (25th and 75th percentile)
Capital efficiency benchmark
The median equity journey gives you the median metrics startups have to reach the typical Series A/B/C.
The chart below gives you a benchmark of your capital efficiency. All things being equal, you are more likely to raise capital if you are more capital efficient than the average. Conversely, if you consume too much cash compared to the average, it will be harder to raise that next round.
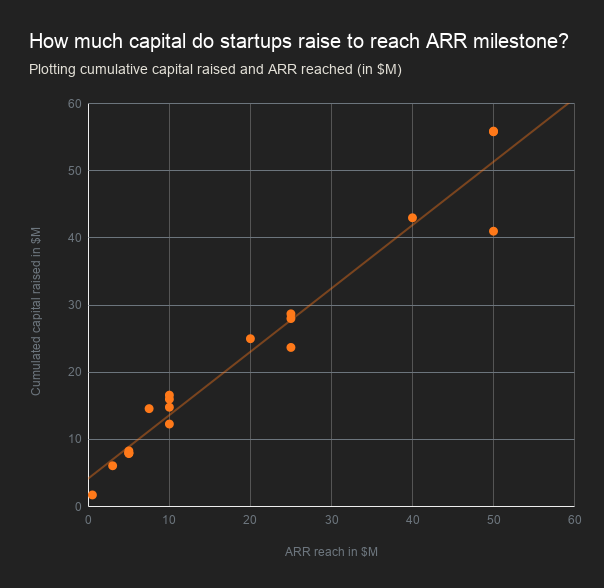
To build this fundraising benchmark, I plotted the cumulative capital raised against the ARR reached. As you can see, the relationship between the two is quite linear (R2 = 0.957)
How do I read that chart? Let’s say you make $15M in ARR. The chart says that, on average, SaaS companies with $15M in ARR have raised cumulatively $18M. How much have you raised? More? then your capital efficiency is greater than the average company. Less? Then you consume more capital than the average SaaS companies with equal ARR performance.
Other factors to take in consideration
This benchmark should be taken for what it is: a benchmark. Reality will often deviate from the average and other factors must be taken in consideration. These factors are the usual dimension assessed by investors such as: team experience and expertise, market size and growth, technology and barriers to entry.
As of March 2020, note that extreme market conditions might impact the benchmark (alongside valuation that are given to founders) since data used are pre-covid-19 pandemics.
Data Sources
- Keybanc SaaS Survey (2016, 2017, 2018, 2019)
- Serena 2020 European SaaS Benchmark
- EY French Venture Capital Barometer 2019
- PWC Moneytree 2019